Standard deviation, explained visually
Standard deviation measures how spread out numbers are: roughly, how far a typical value sits from the mean. Square each value's distance from the mean, average the squares, then take the square root. For 4, 6, 7, 8 and 10 the mean is 7 and the standard deviation is 2. For a sample, divide by n − 1 instead of n.
The standard deviation σ is the square root of the average squared distance from the mean μ: add the squared deviations and divide by N, the number of values. For a sample, subtract the sample mean x̄ and divide by n − 1 instead.
Updated
Concept map
7 ideas, in the order to learn them. Click one and Zidna draws and narrates an animated lesson on it.
Standard Deviation
What standard deviation measures and how it is built, how to find it by hand, when to divide by n − 1, and what it means on a bell curve.
Measuring Spread
The question of how spread out a data set is, which its mean can't answer.Generate lesson2Deviations From the Mean
How far each value lies above or below the mean: the value minus the mean.Generate lesson3Variance
The average of the squared deviations from the mean: spread in squared units.Builds on Deviations From the MeanGenerate lesson4Standard Deviation
The square root of the variance: the typical distance of values from the mean.Builds on Measuring Spread, VarianceGenerate lesson5Calculating Standard Deviation
The method for finding a standard deviation by hand, step by step.Builds on Standard DeviationGenerate lesson6Sample Standard Deviation
The standard deviation estimated from a sample, dividing by n − 1 instead of n.Builds on Standard DeviationGenerate lesson7The Empirical Rule
About 68%, 95% and 99.7% of bell-shaped data lie within 1, 2 and 3 standard deviations.Builds on Standard DeviationGenerate lessonKey ideas
- 01
Standard deviation measures spread: roughly how far a typical value lies from the mean. A small standard deviation means the values cluster near the mean; a large one means they are scattered.
- 02
To find a standard deviation, subtract the mean from each value, square the results, average the squares and take the square root. The average of the squares is the variance.
- 03
Deviations from the mean always add up to zero, so they are squared before averaging. The square root at the end returns the answer to the data's own units.
- 04
Use the population formula (σ, divide by N) when the data is the whole group, and the sample formula (s, divide by n − 1) when it is a sample from a larger group.
- 05
Variance is the standard deviation squared. If heights have a standard deviation of 7 cm, their variance is 49 cm².
- 06
In bell-shaped data, about 68% of values lie within one standard deviation of the mean, about 95% within two and about 99.7% within three.
- 07
Standard deviation is never negative, and it is 0 only when every value is the same. Adding 10 to every value leaves it unchanged; multiplying every value by 3 triples it.
What is standard deviation?
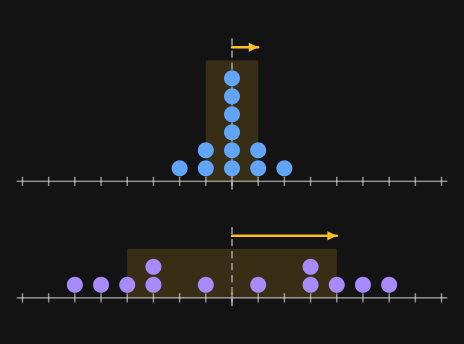
Standard deviation measures how spread out a set of numbers is around its mean. Roughly, it is the typical distance between a value and the mean, in the same units as the data. A small standard deviation means most values sit close to the mean; a large one means they are scattered far from it.
Two classes take the same quiz and both average 10 points. In class A, 10 of the 12 students score 9, 10 or 11. In class B, scores run from 4 to 16. The mean can't tell the two classes apart, but the standard deviation can: 1 point for class A and 4 points for class B, treating each class as the whole group.
| Class | Scores | Mean | Standard deviation |
|---|---|---|---|
| A | 8, 9, 9, 10, 10, 10, 10, 10, 10, 11, 11, 12 | 10 | 1 |
| B | 4, 5, 6, 7, 7, 9, 11, 13, 13, 14, 15, 16 | 10 | 4 |
- A standard deviation of 0 means every value is identical: there is no spread at all.
- A small standard deviation means the values crowd close to the mean, so the mean describes them well.
- A large standard deviation means the values are scattered, and many sit far from the mean.
A standard deviation is a distance, so it is never negative and it is measured in the same units as the data: points, centimeters, hours.
What is the standard deviation formula?
The standard deviation formula takes the square root of the average squared distance from the mean. It comes in two versions: the population formula divides by , the number of values, and is for data that includes every member of the group; the sample formula divides by and is for data sampled from a larger group.
Population standard deviation: for every value x, square its difference from the population mean mu; add up those squares, divide by N, the number of values, and take the square root. The result is sigma.
Sample standard deviation: for every value x, square its difference from the sample mean x-bar; add up those squares, divide by n minus 1, and take the square root. The result is s.
| Symbol | Read as | Meaning |
|---|---|---|
| sigma | standard deviation of a population | |
| s | standard deviation of a sample | |
| mu | mean of a population | |
| x-bar | mean of a sample | |
| x | each value in the data | |
| or | N or n | how many values there are |
| the sum of | add up the expression for every value | |
| or | sigma squared or s squared | the variance: the standard deviation squared |
The two formulas differ in only two places: the mean you subtract ( or ) and the number you divide by ( or ).
How do you calculate standard deviation?
To calculate a standard deviation, find the mean, measure how far each value is from it, square those distances, average the squares and take the square root. Here are the steps for five plant heights, 4, 6, 7, 8 and 10 cm, treated as the whole population.
- 1Find the mean. Add the values and divide by how many there are: .
- 2Find each deviation. Subtract the mean from each value: . The deviations add up to 0, which checks the mean.
- 3Square each deviation: .
- 4Add the squares: .
- 5Divide by the number of values to get the variance: . For a sample, divide by instead.
- 6Take the square root: cm.
| Value x | Deviation x − 7 | Squared deviation (x − 7)² |
|---|---|---|
| 4 | −3 | 9 |
| 6 | −1 | 1 |
| 7 | 0 | 0 |
| 8 | 1 | 1 |
| 10 | 3 | 9 |
| Total: 35 | 0 | 20 |
The standard deviation of 4, 6, 7, 8 and 10 is 2: a typical plant is about 2 cm taller or shorter than the mean height of 7 cm.
Why do we square the deviations?
The deviations in a standard deviation are squared because plain deviations always add up to zero, so their average is zero for every data set, however spread out. The mean is the balance point of the data: the distances below it exactly cancel the distances above it.
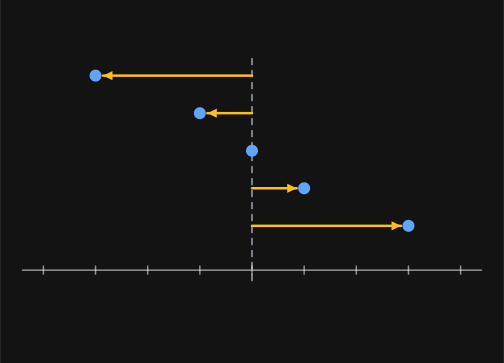
The deviations from the mean always add up to zero.
Squaring fixes this. Every square is positive, so values below the mean can no longer cancel values above it. The average of the squares is the variance, and taking its square root brings the answer back to the data's own units.
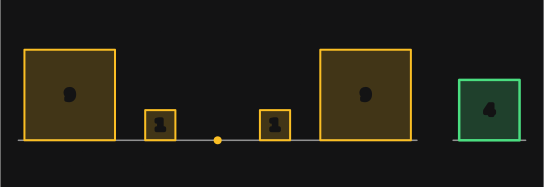
You could average the distances without their signs instead. That gives the mean absolute deviation, 1.6 for this data. Squares are the standard because they make the rest of statistics work: the variances of independent quantities add up, and the bell-shaped normal distribution is described by its mean and standard deviation. Squaring also gives large deviations more weight than small ones.
Sample vs population standard deviation: when do you use n − 1?
Use the population standard deviation, dividing by , when your data includes every member of the group you are describing. Use the sample standard deviation, dividing by , when your data is a sample and you want the spread of the larger group it came from.
Why ? A sample's values sit closer to their own mean than to the true population mean , because is calculated from those very values. So the squared deviations from come out a little too small, and dividing by would underestimate the spread. Dividing by the smaller number corrects this, so that the sample variance is right on average. The adjustment is called Bessel's correction.
| Population | Sample | |
|---|---|---|
| Data | every member of the group | some members, drawn from a larger group |
| Symbol | ||
| Mean subtracted | ||
| Divide by | ||
| For 4, 6, 7, 8, 10 | ||
| TI-84 (1-Var Stats) | σx | Sx |
| Excel and Google Sheets | STDEV.P | STDEV.S |
If a problem calls the data a sample, or asks you to estimate the spread of a larger group, divide by . If the data is the whole group, divide by .
What is the difference between variance and standard deviation?
Variance is the average squared deviation from the mean, and standard deviation is the square root of the variance. They carry the same information, but the standard deviation is in the same units as the data, so it is the one you can read directly. The variance is the step the calculation passes through, and the quantity statisticians work with when they combine spreads.
| Variance | Standard deviation | |
|---|---|---|
| Symbol | or | or |
| What it is | average squared deviation | square root of the variance |
| Units, for heights in cm | cm² | cm |
| For 4, 6, 7, 8, 10 | 4 | 2 |
| To get the other one | take the square root | square it |
So a standard deviation of 7 cm means a variance of 49 cm², and a variance of 2.25 means a standard deviation of .
What does one standard deviation from the mean tell you?
One standard deviation either side of the mean marks the range where most values fall: in bell-shaped data, about 68% of values lie within one standard deviation of the mean, about 95% within two and about 99.7% within three. This is the 68–95–99.7 rule, also called the empirical rule, and it holds for every normal distribution.
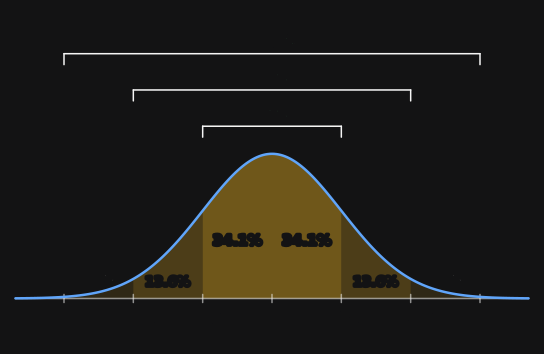
Scores on most modern IQ tests, for example, are scaled to a mean of 100 and a standard deviation of 15. So about 68% of people score between 85 and 115, about 95% score between 70 and 130, and a score of 115, one standard deviation above the mean, sits at about the 84th percentile.
| Within | Share of values | Percentile of the mean plus k standard deviations |
|---|---|---|
| 1 standard deviation | 68.27% | 84.13 |
| 2 standard deviations | 95.45% | 97.72 |
| 3 standard deviations | 99.73% | 99.87 |
Each of these percentages is an area under the curve: the share of the bell that lies between the two boundaries.
The 68–95–99.7 rule is for bell-shaped data only. For any data set at all, Chebyshev's inequality still guarantees that at least 75% of values lie within two standard deviations of the mean.
Worked examples
Population standard deviation of six values
Six friends spent 2, 3, 6, 6, 8 and 11 hours on homework last week. Find the standard deviation of their hours, treating the six friends as the whole group.
- 1The data is the whole group, so use the population formula and divide by .
- 2Mean: hours.
- 3Deviations: . They add up to 0, so the mean is right.
- 4Squares: , which add up to .
- 5Variance: .
- 6Standard deviation: .
Answer: hours: a typical friend's homework time is about 3 hours from the mean of 6.
Sample standard deviation, dividing by n − 1
A biologist measures 5 leaves picked at random from a tree: 5, 7, 9, 9 and 10 cm. Estimate the standard deviation of the lengths of all the leaves on the tree.
- 1The 5 leaves are a sample of the tree's leaves, so use the sample formula and divide by .
- 2Mean: cm.
- 3Deviations: , which add up to 0.
- 4Squares: , which add up to .
- 5Sample variance: .
- 6Sample standard deviation: cm.
- 7Dividing by instead would give cm, the kind of answer that tends to underestimate the spread of all the leaves on the tree.
Answer: cm.
Reading one standard deviation on a bell curve
Test scores are bell-shaped with a mean of 70 and a standard deviation of 8. About what percent of students scored between 62 and 78? Between 54 and 86? Above 86?
- 162 and 78 are and : one standard deviation either side of the mean. About 68% of scores lie between them.
- 254 and 86 are and : two standard deviations either side. About 95% of scores lie between them.
- 3The other 5% lie outside that range, split equally between the two tails, so about scored above 86.
Answer: About 68% between 62 and 78, about 95% between 54 and 86, and about 2.5% above 86.
Which data set has the larger standard deviation?
Data set A is 1, 2, 3, 4, 5, 6, 7, 8, 9. Data set B is 3, 4, 4, 4, 5, 6, 6, 6, 7. Which has the larger standard deviation?
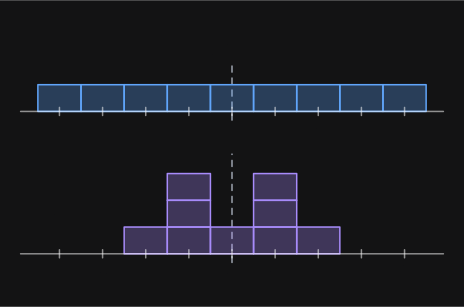
- 1Both sets have 9 values and a mean of 5.
- 2A: the squared deviations are , which add up to , so .
- 3B: the squared deviations are , which add up to , so .
- 4A's values sit farther from the mean, even though its bars are all the same height. B's bars are uneven, but none of its values is more than 2 from the mean.
Answer: A has the larger standard deviation: about 2.58, compared with about 1.25 for B.
Changing units: Celsius to Fahrenheit
A week of daily high temperatures has a mean of 30 °C and a standard deviation of 5 °C. Find the mean and standard deviation in °F, using .
- 1The mean follows the formula: °F.
- 2Multiplying every value by 1.8 multiplies every distance from the mean by 1.8, so the standard deviation becomes °F.
- 3Adding 32 moves every value and the mean by the same amount, so no distance from the mean changes. The standard deviation stays at 9 °F.
Answer: Mean 86 °F, standard deviation 9 °F.
Check yourself
1.What is the standard deviation of 6, 6, 6, 6?Show answer
0. Every value equals the mean, so there is no spread.
2.The variance of a data set is 36. What is its standard deviation?Show answer
6, the square root of 36.
3.Find the population standard deviation of 1, 1, 7, 7.Show answer
3. The mean is 4, and every value is exactly 3 away from it.
4.Find the sample standard deviation of 3, 5, 7.Show answer
2. The squared deviations 4, 0 and 4 add up to 8, and √(8 ÷ 2) = 2.
5.You add 10 to every value in a data set. What happens to the standard deviation?Show answer
Nothing. Every value and the mean move up by 10, so every distance from the mean stays the same.
6.You multiply every value in a data set by 3. What happens to the standard deviation?Show answer
It is multiplied by 3, and the variance is multiplied by 9.
7.Heights are bell-shaped with a mean of 170 cm and a standard deviation of 7 cm. About what percent are between 156 cm and 184 cm?Show answer
About 95%. 156 and 184 are two standard deviations either side of the mean.
8.For the same data, which is larger: the sample or the population standard deviation?Show answer
The sample standard deviation, because it divides by n − 1 instead of n. They are equal only when both are 0.
Common mistakes
- Stopping at the variance and calling it the standard deviation.Finish with the square root. For 4, 6, 7, 8 and 10 the variance is 4 but the standard deviation is . The units are a check: the standard deviation is in the data's units, the variance in squared units.
- Dividing by for a sample, or by for a whole population.Ask whether the data is every member of the group. If it is a sample used to describe a larger group, divide by . On a TI-84 that is Sx; σx is the population version.
- Adding up the deviations first and squaring the total, which gives 0 every time.Square each deviation, then add: , not .
- Rounding the mean before subtracting it from each value.Keep the mean exact, as a fraction or with all its decimals, and round only the final standard deviation. A rounded mean makes the sum of squared deviations come out too large, and the error grows with the number of values.
- Judging spread by how uneven a histogram's bars look.Spread is how far the values sit from the mean along the horizontal axis. A flat histogram stretched across a wide range has a larger standard deviation than a bumpy one bunched near the mean.
- Using the 68–95–99.7 rule on data that isn't bell-shaped.Check the shape first. The rule holds for roughly normal data; for skewed data, the guarantee that still holds is Chebyshev's: at least 75% of values within two standard deviations of the mean.
Questions students ask
Can standard deviation be negative?
No. Standard deviation is the square root of an average of squares, and squares are never negative, so the smallest it can be is 0. If you get a negative answer, look for a sign error in the squaring step.
Can standard deviation be zero?
Yes, but only when every value in the data set is the same. Then every value equals the mean, every deviation is 0 and there is no spread at all.
Can standard deviation be greater than the mean?
Yes. The mean says where the data is centered and the standard deviation says how spread out it is, so neither limits the other. The values −5 and 5 have a mean of 0 and a population standard deviation of 5.
Is standard deviation the average distance from the mean?
Not exactly. It is the square root of the average squared distance, which is never smaller than the plain average distance, called the mean absolute deviation. For 4, 6, 7, 8 and 10 the average distance from the mean is 1.6, while the standard deviation is 2.
Is standard deviation affected by outliers?
Yes, strongly, because each deviation is squared before it is averaged. Adding one value of 30 to the data 4, 6, 7, 8, 10 raises the population standard deviation from 2 to about 8.76. When data has outliers, the interquartile range often describes its spread better.
What is the symbol for standard deviation?
The lowercase Greek letter sigma, σ, stands for the standard deviation of a population, and the letter s for the standard deviation of a sample. Variance is written σ² or s². Calculators label them σx and Sx.
How do you find standard deviation on a TI-84?
Press STAT, choose 1:Edit and type the data into list L1. Then press STAT, move to CALC and choose 1:1-Var Stats with L1 as the list. The results show Sx, the sample standard deviation, and σx, the population standard deviation.
How do you calculate standard deviation in Excel or Google Sheets?
Put the data in a column and type =STDEV.S(A1:A10) for a sample or =STDEV.P(A1:A10) for a whole population, with the range changed to fit your data. Both functions work the same way in Excel and Google Sheets. The older STDEV function gives the sample version.
What is the difference between standard deviation and standard error?
Standard deviation describes how spread out individual values are. Standard error describes how much a sample mean would vary from one sample to the next, and equals the standard deviation divided by √n. Collecting more data shrinks the standard error, while the standard deviation settles near the true spread of the population.
Can you find the standard deviation of two numbers?
Yes. For two values, the population standard deviation is half the distance between them, and the sample standard deviation is that distance divided by √2. For 3 and 9 that gives 3 and about 4.24.
Sources
Keep going
All math topicsStatistics
The normal distribution, explained visually
A normal distribution is a symmetric, bell-shaped distribution centered on its mean, μ, with a width set by its standard deviation, σ. About 68% of values lie within one standard deviation of the mean, 95% within two and 99.7% within three. A z-score, z = (x − μ) ÷ σ, counts standard deviations from the mean.
Calculus
How to find the area under a curve
The area under y = f(x) from x = a to x = b is the definite integral of f from a to b, the limit of sums of ever-thinner rectangles. It equals F(b) − F(a), where F is an antiderivative of f. For y = x² from 0 to 2, F(x) = x³/3, so the area is 8/3 ≈ 2.67. The integral counts area below the x-axis as negative.