How to find the area under a curve
The area under y = f(x) from x = a to x = b is the definite integral of f from a to b, the limit of sums of ever-thinner rectangles. It equals F(b) − F(a), where F is an antiderivative of f. For y = x² from 0 to 2, F(x) = x³/3, so the area is 8/3 ≈ 2.67. The integral counts area below the x-axis as negative.
The area under f from a to b is the integral of f(x) dx from a to b, which equals F(b) minus F(a), where F is any function whose derivative is f.
Updated
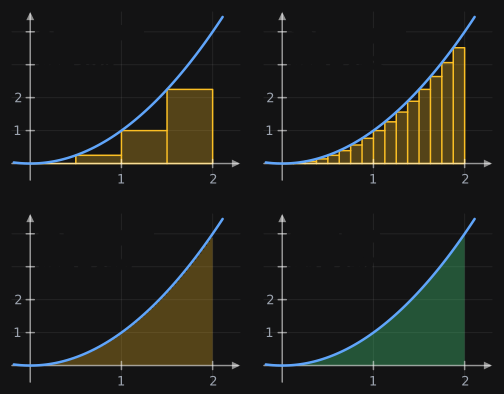
Concept map
8 ideas, in the order to learn them. Click one and Zidna draws and narrates an animated lesson on it.
Area Under a Curve
How to find the exact area under a curve: estimate it with rectangles, make the estimate exact with the definite integral, then compute it with one subtraction using an antiderivative and the fundamental theorem of calculus. Area below the x-axis and the distance a moving object travels show what an integral counts.
Riemann Sums
An estimate of the area under a curve made by splitting it into thin rectangles and adding up their areas.Generate lesson2Antiderivatives
A function whose derivative is the given function: x³/3 is an antiderivative of x², because the derivative of x³/3 is x².Generate lesson3Left, Right and Midpoint Sums
Riemann sums that read each rectangle's height at the left end, the right end or the middle of its strip.Builds on Riemann SumsGenerate lesson4The Definite Integral
The exact area under a curve from x = a to x = b: the limit of its Riemann sums as the rectangles get infinitely thin.Builds on Riemann SumsGenerate lesson5The Trapezoidal Rule
An estimate of the area under a curve made with trapezoids, whose slanted tops join the curve's heights at the two ends of each strip.Builds on Left, Right and Midpoint SumsGenerate lesson6The Fundamental Theorem of Calculus
The theorem that the area under f from a to b equals F(b) − F(a), where F is any antiderivative of f.Builds on The Definite Integral, AntiderivativesGenerate lesson7Net Signed Area
What a definite integral measures when a curve dips below the x-axis: the area above the axis minus the area below it.Builds on The Definite IntegralGenerate lesson8Area Under a Velocity Graph
The area under an object's velocity-time graph: its displacement, or, counting area below the axis as positive, the distance it travels.Builds on The Fundamental Theorem of Calculus, Net Signed AreaGenerate lessonKey ideas
- 01
The area under a curve is the area of the region between the graph of and the -axis from to , written as the definite integral .
- 02
A Riemann sum estimates the area with rectangles: split into strips of width , give each strip a height from , and add the areas.
- 03
Thinner rectangles give closer estimates. The definite integral is the exact area: the limit of the Riemann sums as the number of rectangles goes to infinity.
- 04
The fundamental theorem of calculus finds the exact area in one step: if , then .
- 05
A definite integral counts area below the -axis as negative. For the total area between a curve and the axis, split at the crossings and add the absolute values.
What is the area under a curve?
The area under a curve is the area of the region between the graph of and the -axis, from the vertical line to the vertical line . It is written as a definite integral, , and read "the integral of from to ".
The area under the graph of f from x = a to x = b is the integral from a to b of f of x, d x.
| Symbol | Name | What it means |
|---|---|---|
| Integral sign | A stretched S, for sum: the integral adds up thin strips | |
| and | Lower and upper limits | Where the region starts and stops on the -axis |
| Integrand | The height of the curve above each | |
| Differential | The width of each thin strip, along the -axis |
When the region is a familiar shape, geometry already gives the area, and the integral agrees with it. A region with a curved top, like the one under , has no geometry formula. Calculus finds it by filling the region with thin rectangles.
| Curve and interval | Shape of the region | Area |
|---|---|---|
| from to | Rectangle, 4 wide and 3 tall | |
| from to | Triangle, base 4 and height 4 | |
| from to | Trapezoid with parallel sides 1 and 3 | |
| from to | Half of a circle of radius 2 | |
| from to | Curved top: no formula | , by integration |
How do you find the area under a curve with rectangles?
To find the area under a curve with rectangles, split the interval into thin strips, turn each strip into a rectangle whose height is the function's value at one point in the strip, and add up the rectangles' areas. That total is a Riemann sum, and it estimates the area under the curve.
- 1Choose the number of rectangles and find the width of each: .
- 2Mark the strip edges , , , up to .
- 3In each strip pick one point, its left end, its right end or its midpoint, and find the height there.
- 4Multiply each height by and add. The total estimates the area.
A Riemann sum adds, over all n strips, the height of f at the point chosen in each strip times the strip width delta x.
For from to with rectangles, and the strip edges are , , , and . The three usual choices of height give three estimates.
| Sum | Heights used | Estimate |
|---|---|---|
| Left | , , , | |
| Right | , , , | |
| Midpoint | , , , |
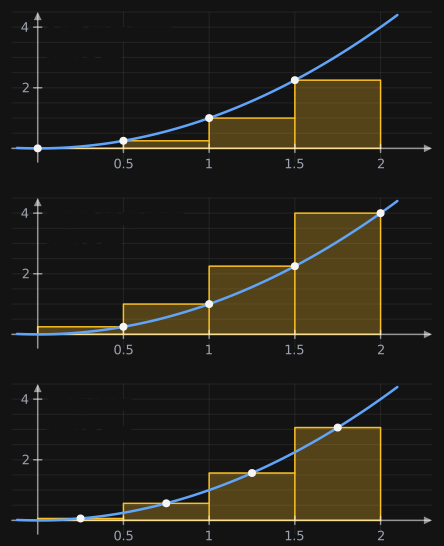
Each term in a Riemann sum is an area, height times width. More, thinner rectangles hug the curve more closely, so the estimate gets better as grows.
Do left or right Riemann sums overestimate?
Whether a left or right Riemann sum overestimates depends on whether the function rises or falls. On an increasing function, a left Riemann sum underestimates the area and a right Riemann sum overestimates it, because each left rectangle takes the lowest height in its strip and each right rectangle the highest. On a decreasing function it is the other way around.
| Function on [a, b] | Left sum | Right sum |
|---|---|---|
| Increasing | Underestimate | Overestimate |
| Decreasing | Overestimate | Underestimate |
| Rises and falls | Can be either | Can be either |
The trapezoidal rule replaces each rectangle with a trapezoid whose slanted top joins the curve's heights at the two ends of the strip. Its estimate is the average of the left and right sums: for on with 4 strips, .
The trapezoidal rule is delta x over 2 times the sum of the first height, twice every inside height, and the last height.
The midpoint and trapezoid estimates miss in opposite directions, and which way depends on how the curve bends, its concavity.
| Curve on [a, b] | Midpoint sum | Trapezoidal rule |
|---|---|---|
| Bends upward (concave up), like | Underestimate: | Overestimate: |
| Bends downward (concave down), like | Overestimate | Underestimate |
For a function that only rises or only falls on , the exact value of always lies between its left and right Riemann sums.
Is the integral the area under the curve?
Yes, where the curve is above the -axis: the definite integral is the exact area under the curve from to . It is defined as the limit of the Riemann sums as the number of rectangles goes to infinity and their width shrinks to .
The integral of f from a to b is the limit, as the number of rectangles n goes to infinity, of the Riemann sum of f times delta x.
| Rectangles n | Left sum | Midpoint sum | Right sum |
|---|---|---|---|
The left sums climb and the right sums fall toward the same number, , so . For a continuous function the choice of point in each strip doesn't matter: left, right and midpoint sums all reach the same limit.
The notation keeps the shape of the Riemann sum. The became , a stretched S for sum; the height became ; and the width became , a strip so thin its width has shrunk toward .
The definite integral equals the area only where the curve is above the -axis. Where the curve dips below it, the integral counts that area as negative.
How do you find the area under a curve using integration?
To find the area under a curve using integration, find an antiderivative of , a function whose derivative is , and subtract its values at the two ends: the area is . This shortcut is the fundamental theorem of calculus, and it replaces the limit of Riemann sums with two substitutions and a subtraction.
The integral of f from a to b equals F of x evaluated from a to b: F of b minus F of a, where the derivative of F is f.
- 1Write the area as a definite integral, . Check that on ; if the curve crosses the -axis, split the integral at each crossing.
- 2Find an antiderivative . For a power of , raise the exponent by one and divide by the new exponent.
- 3Work out at the upper limit and at the lower limit.
- 4Subtract: the area is , in square units.
For from to : an antiderivative is , so the area is , the number the Riemann sums were closing in on.
| Function f(x) | Antiderivative F(x) | Example |
|---|---|---|
| , a constant | ||
| , for | ||
Any antiderivative gives the same area. With the area under from to is : the constant cancels, which is why a definite integral needs no .
Why is the area under a curve the antiderivative?
The area under a curve comes from an antiderivative because the area grows at a rate equal to the curve's height. Let be the area under from a fixed point up to . Move a little to the right, to , and the area gains a thin strip about tall and wide, so .
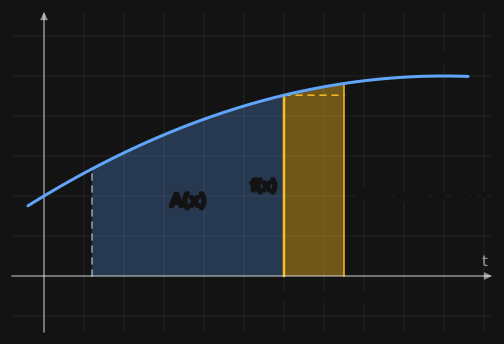
Divide by : . When is continuous, as the strip becomes a perfect rectangle and the approximation becomes exact, so . The area function is an antiderivative of . This is the first part of the fundamental theorem of calculus.
The derivative, with respect to x, of the area under f from a to x is f of x, the height of the curve at x.
The second part follows from it. Every antiderivative of differs from by a constant, and , since a region with no width has no area. So , and the area from to is .
| Part | Statement | What it says |
|---|---|---|
| First | The rate at which the area grows is the height of the curve | |
| Second | Any antiderivative turns an area into a subtraction |
Integration and differentiation undo each other: the slope of the area function at is the height of the curve at .
Can the area under a curve be negative?
An area is never negative, but a definite integral can be. Where a curve lies below the -axis, is negative, so every rectangle there adds a negative amount, and the integral counts that area as negative. A definite integral gives the net signed area: the area above the axis minus the area below it.
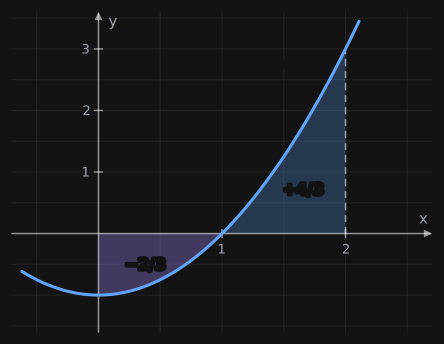
With the antiderivative : and .
| Quantity | Calculation | Value |
|---|---|---|
| Net signed area | ||
| Total area |
To find the total area between a curve and the -axis:
- 1Solve to find where the curve crosses the -axis between and .
- 2Split at those crossings and integrate over each piece.
- 3Take the absolute value of each piece's integral and add them.
The net signed area is what the definite integral gives; the total area is how much region there is. A question asking for the area between a curve and the -axis wants the total.
What does the area under a curve represent?
The area under a curve represents a total: it adds up the quantity on the -axis across the -axis, so its units are -units times -units. Under a velocity–time graph, meters per second times seconds gives meters, so the area is the displacement, how far the object ends up from where it started.
A car driving at a steady m/s for s has a flat velocity graph, and the area under it is a rectangle: m, the distance the car covers. When the velocity changes, the integral of the velocity gives the same kind of total.
| Graph | Area under it | Units |
|---|---|---|
| Velocity against time | Displacement, the change in position | m/s × s = m |
| Acceleration against time | Change in velocity | m/s² × s = m/s |
| Flow rate against time | Volume that has flowed | L/min × min = L |
| Force against distance | Work done | N × m = J |
| Power against time | Energy used | kW × h = kWh |
| Probability density against value | Probability | No units; the whole area is 1 |
This runs the derivative backward: the derivative of position is velocity, and the area under velocity gives back the change in position. Under a normal distribution curve, the area between two values is the probability of a result landing between them.
Worked examples
Left, right and trapezoid estimates from a table
A runner's velocity is measured every 2 seconds. At s it is m/s. Estimate the distance covered from to s with a left Riemann sum, a right Riemann sum and the trapezoidal rule.
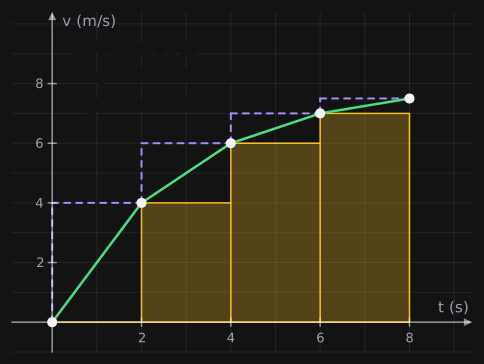
- 1There are 4 strips, each s wide. With 5 measurements, a left sum uses the first 4 velocities and a right sum the last 4.
- 2Left sum: m.
- 3Right sum: m.
- 4Trapezoidal rule: m, the average of and .
- 5If the velocity rises the whole time, as the measurements suggest, the left sum is too low and the right sum too high, so the true distance is between m and m.
Answer: Left sum m, right sum m, trapezoidal rule m. The best estimate of the distance is about m.
The area under y = x² from 0 to 2, both ways
Find the exact area under from to , first as the limit of right Riemann sums, then with the fundamental theorem of calculus.
- 1Width and points: , and the right endpoints are for .
- 2Heights: .
- 3Riemann sum: .
- 4Use : . Check with : , the right sum found with 4 rectangles.
- 5Take the limit: as .
- 6With the fundamental theorem: an antiderivative of is , so .
Answer: The area is square units both ways. The fundamental theorem gets there in one line.
The area under a square root curve
Find the area under from to .
- 1Check the sign: on , so the integral is the area.
- 2Rewrite as a power: .
- 3Antiderivative: raise the exponent to and divide by , giving .
- 4Evaluate: , and .
- 5Subtract: .
Answer: square units.
Displacement and distance from a velocity curve
A particle moves along a line with velocity m/s. Find its displacement and the total distance it travels from to s.
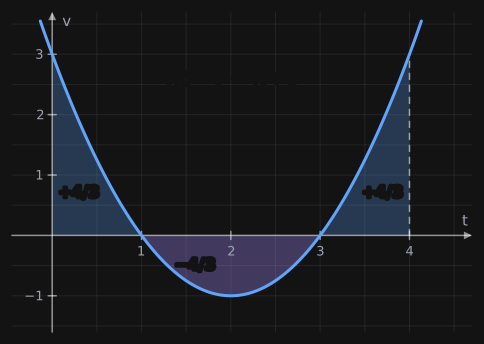
- 1Find where the velocity is : at and . The particle moves forward, then backward, then forward again.
- 2Antiderivative: , with , , and .
- 3Integrate each piece: , and .
- 4Displacement is the net signed area: m.
- 5Distance is the total area: m.
Answer: The displacement is m forward, and the particle travels m in all.
Check yourself
1.4 rectangles of equal width cover the interval from x = 1 to x = 9. How wide is each?Show answer
2, since (9 − 1) ÷ 4 = 2.
2.Estimate the area under y = x² from 0 to 2 with a right Riemann sum of 2 rectangles.Show answer
5. Each rectangle is 1 wide, with heights f(1) = 1 and f(2) = 4, so 1 × 1 + 4 × 1 = 5.
3.f is increasing on [a, b]. Does a left Riemann sum overestimate or underestimate the area under it?Show answer
Underestimate. Each left rectangle takes the lowest height in its strip, so it sits under the curve.
4.What is the area under y = 3 from x = 1 to x = 5?Show answer
12. The region is a rectangle 4 wide and 3 tall.
5.Find the integral of x² from 0 to 3.Show answer
9. An antiderivative is x³/3, and 27/3 − 0 = 9.
6.Find the area under y = 2x from x = 0 to x = 4.Show answer
16. An antiderivative is x², and 16 − 0 = 16. The region is also a triangle with base 4 and height 8.
7.Find the integral of √x from 0 to 4.Show answer
16/3 ≈ 5.33. Write √x as x^(1/2); an antiderivative is (2/3)x^(3/2), and (2/3) × 8 = 16/3.
8.F is an antiderivative of f, with F(1) = 4 and F(3) = 10. What is the integral of f from 1 to 3?Show answer
6, since F(3) − F(1) = 10 − 4 = 6.
9.The integral of f from 0 to 2 is 5, and from 2 to 5 it is −3. What is the integral of f from 0 to 5?Show answer
2. Integrals over neighboring intervals add: 5 + (−3) = 2.
10.What is the integral of x³ from −1 to 1?Show answer
0. The area below the x-axis from −1 to 0 cancels the equal area above it from 0 to 1.
11.A car drives at a steady 15 m/s for 8 seconds. What is the area under its velocity graph, and what does it mean?Show answer
120 m: the 8-by-15 rectangle under the graph is the distance the car travels.
Common mistakes
- Adding the heights in a Riemann sum and forgetting the width: for 4 right rectangles under on , answering .Multiply by : . Each term of a Riemann sum is a rectangle's area, height times width.
- Using all values in a table for a left or right Riemann sum.With strips, a left sum uses the first heights and leaves out the last; a right sum uses the last and leaves out the first.
- Subtracting in the wrong order, , and getting the area with the wrong sign.Upper limit minus lower limit: . For , that is , not .
- Forgetting when the lower limit isn't : writing .Always subtract the antiderivative at the lower limit: .
- Integrating straight across a curve that dips below the -axis and calling the result the area: .Split at the crossing and add the absolute values: . The integral gives net signed area, and area itself is never negative.
- Finding an antiderivative the way you find a derivative: writing the antiderivative of as , or as .Raise the exponent by one, then divide by the new exponent: . Check by differentiating: the derivative of is .
Questions students ask
What is the area under a curve called?
It is called the definite integral of the function between the two x-values, written ∫ from a to b of f(x) dx, and finding it is called integration. In statistics, medicine and machine learning the same idea is often shortened to AUC, for area under the curve.
Is the derivative the area under a curve?
No. The derivative is the slope of a curve at a point, and the integral is the area under it. The two are inverse operations: by the fundamental theorem of calculus, the derivative of the area function of f is f itself.
What is the difference between a definite and an indefinite integral?
A definite integral has limits, a and b, and its value is a number: the net signed area under the curve between them. An indefinite integral has no limits, and its value is a family of functions, every antiderivative F(x) + C. For example, the indefinite integral of x² is x³/3 + C, while the definite integral of x² from 0 to 2 is 8/3.
Why don't you add + C to a definite integral?
Because it cancels. With the antiderivative F(x) + C, the definite integral is (F(b) + C) − (F(a) + C) = F(b) − F(a), so every value of C gives the same answer. That is why the simplest antiderivative, with C = 0, is the one used.
What does dx mean in an integral?
dx stands for the width of an infinitely thin strip along the x-axis: the limit of the Δx in a Riemann sum. It also names the variable of integration, telling you the function is integrated with respect to x. Each piece f(x) dx is a strip's height times its width, and the integral adds them all up.
How do you find the area under a curve without integration?
If the region is made of familiar shapes, such as rectangles, triangles, trapezoids or parts of circles, add their areas with geometry. Otherwise, estimate it with a Riemann sum or the trapezoidal rule using many thin strips, which also works when all you have is a table of measured values. On graph paper, you can count the squares under the curve and multiply by the area of one square.
How do you find the area under a curve on a calculator?
On a TI-84, choose fnInt( from the MATH menu and enter the function, the variable and the two limits, or graph the function and choose ∫f(x)dx from the CALC menu. In Desmos, type int to get an integral sign, then fill in the limits and the function. A calculator returns the definite integral, so parts of the curve below the x-axis still count as negative.
How do you find the area under a curve in Excel?
Excel has no integral function, so add up trapezoids from your data. Put the x-values in column A and the y-values in column B, starting in row 2. In C3 enter =(A3-A2)*(B2+B3)/2, the area of the trapezoid between rows 2 and 3, fill it down to the last row, and add column C with SUM. More closely spaced x-values give a closer estimate.
Is the area under a curve always 1?
No. The area is always 1 only under a probability density curve, such as the normal curve, because the whole area there is the probability of every possible outcome together. For any other function the area depends on the curve and the interval: under y = x² from 0 to 2 it is 8/3.
Sources
Keep going
All math topicsCalculus
What is a derivative?
A derivative is the slope of a curve at a single point: how fast the function's output is changing at that exact input. Draw a line through two points on the curve and slide one point toward the other; the slope the line settles on is the derivative. For f(x) = x², the derivative is 2x, so the slope is 2 at x = 1.
Algebra
How to find the slope of a line
To find the slope of a line, take two points on it and divide the change in y (the rise) by the change in x (the run): slope = (y₂ − y₁) ÷ (x₂ − x₁). For (1, 1) and (5, 4), the slope is (4 − 1) ÷ (5 − 1) = 3/4. If the equation is written as y = mx + b, the slope is m.
Statistics
The normal distribution, explained visually
A normal distribution is a symmetric, bell-shaped distribution centered on its mean, μ, with a width set by its standard deviation, σ. About 68% of values lie within one standard deviation of the mean, 95% within two and 99.7% within three. A z-score, z = (x − μ) ÷ σ, counts standard deviations from the mean.